
How to Measure PR Results: The Metrics That Matter, Why AVE Is Rejected, and a Reporting Framework
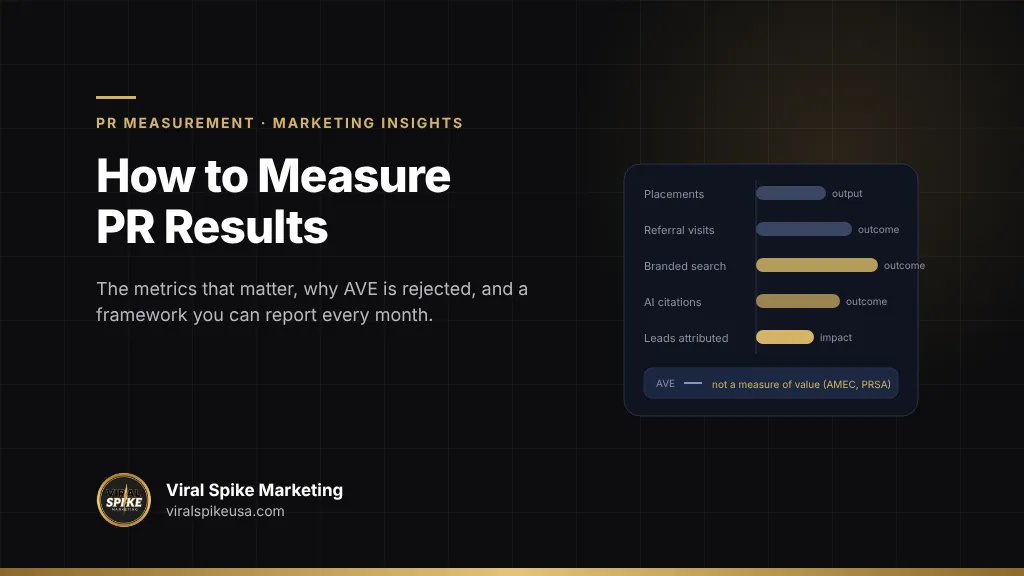
To measure PR results, track the outputs you can count (placements, their quality, the audience they could reach) and then the outcomes they cause (referral visits, branded search lift, backlinks, AI citations, and leads that mention coverage), and report both against the goal you set before the campaign started. Do not report advertising value equivalency (AVE), the practice of pricing an article as if it were an ad: the industry’s own measurement body, AMEC, states in the Barcelona Principles that “AVEs are not the value of communication,” and PRSA’s measurement guidance has rejected the method since 2010. A working PR scorecard fits on one page. Outputs: number of placements, outlet tier, whether the piece is indexed and links to you, and the message it carried. Outcomes: sessions from referral and from branded search in the weeks after each piece, new referring domains, how often AI assistants cite or recommend you across a fixed prompt set, and inbound leads that name the coverage. Report monthly, review quarterly, and judge the program over a quarter rather than a week, because most PR effects compound and lag.
Key takeaways
- Measure outputs and outcomes separately. A placement is an output; what people did after reading it is the outcome, and only the outcome answers “was this worth it.”
- Reach and impressions describe an outlet’s audience, not your readers. Report them with that caveat or not at all.
- AVE is rejected by AMEC’s Barcelona Principles (principle five), by the Institute for Public Relations’ measurement commission, and in PRSA’s published guidance. Clients who are shown AVE are being shown a number nobody in the field defends.
- Branded search and referral traffic are the two cheapest, most defensible outcome metrics, and both come from tools you already have: Search Console and GA4.
- AI citation share is now a PR metric. Coverage in sources that ChatGPT, Gemini and Google’s AI features trust changes whether you are recommended; track it on a fixed prompt set monthly.
What should PR measurement actually answer?
Three questions, in order: did the work happen, did it reach and register with the audience, and did the audience do something that matters to the business? That ladder is the structure of AMEC’s Integrated Evaluation Framework, a free, non-proprietary planning tool that walks from objectives through inputs, activities, outputs, out-takes, outcomes and impact. You do not need the whole framework to run a small program, but you need the distinction it enforces: a count of articles is not a result, and a result that cannot be traced to an article is not PR measurement.
The first principle of the Barcelona Principles 3.0, AMEC’s 2020 revision of the standards most of the profession works to, is that “setting goals is an absolute prerequisite to communications planning, measurement, and evaluation.” In practice that means writing down, before the first pitch, what the coverage is for: more inbound demand, a stronger answer when a buyer searches your name, credibility for a raise or a visa, a corrected narrative after a bad story, or a seat in the AI answers your category produces. Each goal has a different lead metric, and a program measured against the wrong goal looks like a failure even when it worked. How long each goal usually takes to show up is covered in how long PR takes to work.
Which PR metrics matter?
Eight metrics cover most programs. The first three are outputs, the rest are outcomes.
1. Placements, with quality
Count the articles, interviews, quotes and features that ran, then grade each on four things: outlet tier (a recognized national or trade outlet versus a content farm), placement type (a feature about you, a quote in someone else’s story, a byline, a mention), whether the piece is indexed on Google and still live, and whether it links to your site. Ten mentions in unindexed syndicated copies are worth less than one indexed feature. How to tell real outlets from look-alikes is in how to verify a publication is real.
2. Message pull-through
Did the article say what you needed it to say? Score each piece on whether it carried your key message, named your category correctly, spelled the company and the spokesperson right, and framed you as recommended, neutral or cautionary. A placement that gets your category wrong is a liability in AI answers, which read it as fact.
3. Potential reach, with caveats
Unique monthly visitors to the outlet, or circulation, is the ceiling on how many people could have seen the piece, not an estimate of how many did. Report it as “potential reach,” never as “impressions” or “views,” and do not sum it across outlets as if the audiences were distinct. Reach is useful for comparing outlets against each other; it is not evidence of an outcome.
4. Referral traffic
Sessions that arrived at your site by clicking a link in the coverage. Google Analytics 4 groups these under the Referral channel, which it defines as traffic from unpaid links on other websites or apps, such as blogs and news outlets. Filter by source domain to attribute sessions to a specific article, and look at the two to four weeks after publication. Referral volume from editorial coverage is usually modest; the point is who arrives and what they do, so pair sessions with conversions.
5. Branded search lift
The number of people who searched your company or founder name after the coverage ran. This is the clearest signal that an article was read by people who then wanted more. Pull it from the Search Console Performance report, which gives clicks and impressions by query; group the queries that contain your brand name and compare the four weeks after a placement with the four before. GA4’s Organic Search channel also now includes traffic from Google’s AI-generated answer features, per the same channel definitions.
6. Backlinks and referring domains
New domains linking to you as a result of coverage. One indexed editorial link from a recognized outlet is a durable asset; a hundred nofollowed links from syndicated press-release copies are not. Count referring domains, not raw links, and note which are editorial. Why mentions sometimes matter more than links is covered in brand mentions vs backlinks.
7. AI citations and recommendations
Whether ChatGPT, Gemini, Perplexity, Claude and Google AI Overviews name or cite you when asked questions a buyer would ask. Build a fixed set of 20 to 50 prompts (category questions and questions about you by name), run them monthly on each engine, and log mention share, citation share, accuracy and framing. Coverage in trusted outlets is one of the main inputs these systems weigh, so this metric is where PR and AI visibility meet; the tools and method are in AI visibility tools and metrics.
8. Lead attribution
Inbound inquiries, demo requests, applications or sales that can be tied to coverage. Three sources: a “how did you hear about us” field with a press option, UTM-tagged links where an outlet permits them, and sales notes that record when a prospect mentions an article. Attribution will undercount, because people read a piece, remember the name and search for it later. That is why branded search sits beside it.
Why is AVE (earned media value) rejected?
Advertising value equivalency multiplies the size or duration of a piece of coverage by the outlet’s advertising rate, sometimes with a multiplier of three or more to reflect that editorial is “more credible” than ads. “Earned media value” (EMV) is usually the same calculation with a newer name, and influencer EMV formulas apply a similar per-impression price. The appeal is obvious: it produces a dollar figure. The problem is that the figure measures nothing.
The industry rejected it formally in 2010. The Institute for Public Relations’ Commission on Measurement and Evaluation adopted a task force report against AVE in October 2010, aligned with the Barcelona Declaration adopted that June, and set out the reasons: there is no evidence that paid advertising space and earned editorial space have equivalent value; advertisers control content, placement and frequency and their messages are almost always positive, while earned coverage is only partly controllable and can be positive, neutral or negative; and advertising cost is a cost of achieving an outcome, not an outcome itself. In PRSA’s Public Relations Tactics (February 2012), Ketchum’s David Rockland put it plainly: “AVEs are based on the cost of advertising. AVEs are not the value of public relations,” adding that “standard multipliers showing that earned media is more valuable than paid media don’t exist” and that “impressions and hits alone are meaningless.”
The Barcelona Principles have been revised since, most recently in July 2020. Principle five of version 3.0 reads: “AVEs are not the value of communication.” Other principles in the same set require measuring outputs, outcomes and impact; including qualitative and quantitative analysis; covering all relevant online and offline channels; and rooting evaluation in integrity and transparency.
For a buyer: if an agency’s report leads with “$1.2 million in earned media value,” ask what that number predicts. It does not predict traffic, leads, search behavior or AI recommendations; it describes what space would have cost to buy. A report built on AVE is usually a report with no outcome data behind it.
A PR measurement framework you can use
The table maps each metric to its source, how to collect it, what it is evidence of and the caveat to print beside it. Pick the rows that match your goal; a reputation program weights accuracy and framing, a demand program weights branded search and leads.
| Metric | Level | Source | How to collect | Evidence of | Caveat |
|---|---|---|---|---|---|
| Placements (count, tier, type, indexed, linked) | Output | Coverage log | Log each piece with URL, outlet, date, type, index status, link status | Activity and quality of the work | A count says nothing about effect |
| Message pull-through and framing | Output / out-take | Coverage log | Score each piece: key message present, category correct, framing recommended / neutral / cautionary | Whether coverage says what you need said | Subjective; use one rubric consistently |
| Potential reach | Output | Outlet audience data | Record monthly unique visitors or circulation per outlet | Size of the possible audience | Not readers of your piece; never sum across outlets |
| Referral sessions and conversions | Outcome | GA4 Referral channel | Filter by source domain; compare 4 weeks post-publication | People who clicked through and acted | Undercounts; many readers search later instead |
| Branded search clicks and impressions | Outcome | Search Console Performance report | Group brand-name queries; compare 4 weeks before vs after | Readers who wanted more | Seasonality and ads also move it; annotate campaigns |
| Referring domains (editorial) | Outcome | Backlink tool or Search Console Links report | Count new domains; tag editorial vs syndicated | Durable search authority | Nofollow and syndicated links add little |
| AI mention and citation share | Outcome | Fixed prompt set on each engine | Run 20 to 50 prompts monthly; log mentions, citations, accuracy, framing | Whether you are recommended where buyers ask | Answers vary by session; judge direction over 3 months |
| Leads and revenue attributed | Impact | CRM, forms, sales notes | “How did you hear” field, UTMs where permitted, sales notes | Business result | Undercounts; pair with branded search |
Two rules make the framework hold up: log the goal and the baseline before the first placement runs, and annotate every placement date on your analytics so lifts can be read against the calendar.
How do you connect a placement to business results?
Attribution is where most PR reporting collapses, because the accurate answer is “partly.” The method that holds up is triangulation: three independent signals moving together in the fortnight after a feature are hard to explain any other way.
- Annotate the date. Mark the publication date in GA4 and in your Search Console notes.
- Check referral. Sessions from the outlet’s domain, and what those sessions did (pages per session, form fills, demo requests).
- Check branded search. Impressions and clicks for your brand queries, week over week, for four weeks.
- Check the CRM. New inbound records in the window, and whether any mention the piece. Ask sales to log it.
- Check the AI prompt set. Did the piece appear as a cited source, and did your mention share change in the next monthly run?
Keep in mind what the search surface now looks like. Pew Research Center tracked 900 US adults’ Google use in March 2025 and found users clicked a traditional result in 8 percent of visits when an AI summary appeared versus 15 percent without one, and clicked a source link inside the summary in about 1 percent. A placement that becomes a cited source in those summaries is doing work that referral traffic will never show, which is why the AI prompt set belongs on the scorecard rather than in a footnote. The mechanics are in how press coverage gets your brand recommended by ChatGPT.
What reporting cadence works?
| Cadence | What to report | Audience | Format |
|---|---|---|---|
| Per placement (within 48 hours) | URL, outlet, type, index and link status, message score, potential reach, early referral | Marketing lead | One row added to the coverage log, plus a short note |
| Monthly | Placements by tier, referral sessions and conversions, branded search vs prior month, new referring domains, AI mention and citation share, leads attributed, share of voice | Founder or CMO | One-page scorecard with the goal at the top and a three-line commentary |
| Quarterly | Trend lines for the outcome metrics, what moved after which placements, cost per outcome, what to stop and start | Leadership | Short deck or memo; decisions, not data dumps |
Monthly is the right rhythm because most PR outcomes lag publication by two to six weeks and AI engines re-crawl sources on a similar cycle. Weekly outcome reporting produces noise. The exception is a crisis or a launch, where daily monitoring is appropriate for a short window.
Whatever the cadence, the scorecard should open with the goal set at the start and close with a decision. “We ran four features, branded search rose 28 percent, AI mention share went from 2 of 20 prompts to 6 of 20, and the trade outlet produced the only attributed leads, so next quarter we weight trade press” is a report. A list of logos is not.
Common PR measurement mistakes
- Reporting reach as results. An outlet’s monthly audience is not your readership. Label it potential reach and move on.
- Summing impressions across syndication. A press release that appears on 300 partner sites did not reach 300 audiences; most copies are unindexed and unread. The difference between a syndicated release and an article is explained in press release distribution cost.
- Using AVE or EMV because the client asked. Explain why the field rejected it, and offer branded search and referral in its place. A client who insists can have the number in an appendix, labeled.
- No baseline. Pull 12 weeks of branded search, referral and the AI prompt set before the first pitch goes out.
- Judging a program in week two. Outcomes lag. Review monthly; decide quarterly.
- Ignoring accuracy. A feature that misstates what you do is now training data for the next AI answer about you. Score it, and request a correction.
- Treating a guaranteed placement differently from an earned one. Both are measured the same way once they are live: indexed, linked, read, cited. What differs is predictability, which is a planning question, not a measurement one; see are guaranteed press placements worth it.
Where Viral Spike fits
Viral Spike Marketing reports against this framework, not against AVE. Every public relations engagement starts with a written goal and a baseline of branded search, referral traffic, referring domains and a fixed AI prompt set across ChatGPT, Gemini, Perplexity, Claude and Google’s AI features. Guaranteed editorial placements across 1,600+ outlets are logged with the same fields as earned coverage: you approve the draft, the article is published and indexed on Google, and the engagement is refunded in full if it never runs, so the output side of the scorecard is predictable and the outcome side can be read cleanly. Monthly scorecards go to the client with the goal at the top and a decision at the bottom. If you want to see what a baseline looks like for your company before committing to anything, ask for one.
Start with a baseline this week
Before the next pitch or placement, export 12 weeks of branded-query clicks and impressions from Search Console, 12 weeks of Referral sessions by source from GA4, your current list of referring domains, and the answers to 20 prompts a buyer would ask an AI assistant about your category and your name. Put the goal in one sentence at the top of that document. Everything you report from now on is a comparison against that page, and every placement, earned or guaranteed, gets judged by what it moved on it.
Frequently asked questions
What are the most important PR metrics?
Placements graded by outlet tier, type, index status and links (an output), then the outcomes they cause: referral sessions and conversions, branded search lift in Search Console, new editorial referring domains, AI mention and citation share across a fixed prompt set, and leads that can be attributed to coverage. Message accuracy and framing matter alongside volume, because an article that misdescribes you is read as fact by search engines and AI assistants.
What is AVE in PR and why is it not used?
Advertising value equivalency prices an article as if it were an ad of the same size, sometimes multiplied by three or more. AMEC’s Barcelona Principles state that AVEs are not the value of communication, the Institute for Public Relations’ measurement commission rejected it in 2010, and PRSA’s guidance has said the same since. It measures what the space would cost to buy, not what the coverage did, and predicts no business outcome.
How do you measure PR ROI?
Set the goal first, then triangulate: attributed leads or revenue from a ‘how did you hear about us’ field, UTMs and sales notes; branded search lift in the weeks after each placement; referral sessions and conversions from coverage; and changes in AI mention share. Divide the business result by program cost for a rough ROI, and state that attribution undercounts because many readers search for you later rather than clicking.
How do you measure branded search lift from PR?
In the Search Console Performance report, filter or group queries that contain your company or founder name, then compare clicks and impressions for the four weeks after a placement with the four weeks before. Annotate placement dates so lifts line up with coverage. Control for other causes such as ad campaigns or seasonality, and read the trend over a quarter rather than a single week.
How often should PR results be reported?
Log each placement within 48 hours, send a one-page scorecard monthly, and review trends and decisions quarterly. Monthly fits the lag between publication and outcomes, which is usually two to six weeks, and the cycle on which AI engines re-crawl sources. Daily monitoring is appropriate only during a launch or a crisis. Every report should open with the original goal and end with a decision.
Can you measure PR’s effect on AI answers?
Yes. Build a fixed set of 20 to 50 prompts, including category questions and questions about you by name, and run them monthly on ChatGPT, Gemini, Perplexity, Claude and Google’s AI features. Record whether you are mentioned, whether your pages or your coverage are cited, whether the statements are accurate and whether you are framed as recommended. Compare each monthly run against the baseline and against named competitors.
Sources
Primary sources referenced in this article, in order of first use.
- Integrated Evaluation Framework (amecorg.com)
- Barcelona Principles 3.0 (business-school.open.ac.uk)
- defines (support.google.com)
- Performance report (support.google.com)
- Institute for Public Relations' Commission on Measurement and Evaluation (instituteforpr.org)
- Public Relations Tactics (prsay.prsa.org)
- version 3.0 (amecorg.com)
- Pew Research Center (pewresearch.org)

More in Marketing Insights



Related services